STEAMing Through The MIT Challenge at The Village School
At the start of November, every class at The Village High School was assigned to complete a project for the MIT Challenge. Almost every year, the school partners with the Massachusetts Institution of Technology to create produce topical, socially impactful, and innovative projects within our school community. This year, the challenge was geared towards tropical cyclones.
Every class in each grade was required to create a project that addressed tropical cyclones in a way that was relevant to the subject. Journalism classes published articles on the online school newspaper regarding how to prepare for hurricanes, chemistry classes made periodic tables out of tropical cyclone data, math classes created graphs and reports regarding the correlation between different parts of a hurricane(ex. wind speed, atmospheric pressure, velocity), Spanish classes delivered oral presentations in regarding Harvey, psychology classes created support group brochures for trauma from natural disasters, and biology classes created videos showcasing the adaptations of specific coral reefs.
“The MIT challenges were incredibly diverse across classes,” said junior Regina Blenda, a student taking a variety of different STEM and humanities IB courses. “For example, in English class, we were analyzing and giving a presentation on the symbolism behind a literal storm in fiction while in French class, we were singing about tropical storms! The variety of MIT activities allowed me to think about hurricanes from so many different perspectives.”
For my IB Analysis and Approach Higher Level math class, my partner and I studied the correlation between the maximum wind speed and minimum atmospheric pressure of tropical cyclones in the Atlantic between 2017 and 2021. Although it started out as an assignment, we learned loads along the way. In order to collect data on this subject, we pulled records from a data library The National Hurricane Center (NHC) and the National Oceanic and Atmospheric Administration (NOAA) collaborated to create. After organizing the endless data archives onto a spreadsheet we used a stratified sampling technique to create our sample pool. We then plotted the points and studied the trend through various graphs including bar graphs, scatter plots, and box-and-whiskers plots. Overall, the MIT Challenge not only gave us practice for writing IB-style reports and evaluations but also allowed us to think critically about the environment in a way that is mathematically thrilling and challenging.
“The MIT Challenge was an amazing experience!” said junior Caroline Hsu, my partner in the IB Math MIT assignment. “As a dedicated student who always yearns to learn more, I really loved learning about hurricanes. Ever since I was a small child, I was fascinated by weather phenomena and wanted to learn more about analyzing them, and our math project analyzed hurricanes by comparing maximum wind speed and minimum air pressure, and I enjoyed getting to learn new techniques of research and making new graphs.”
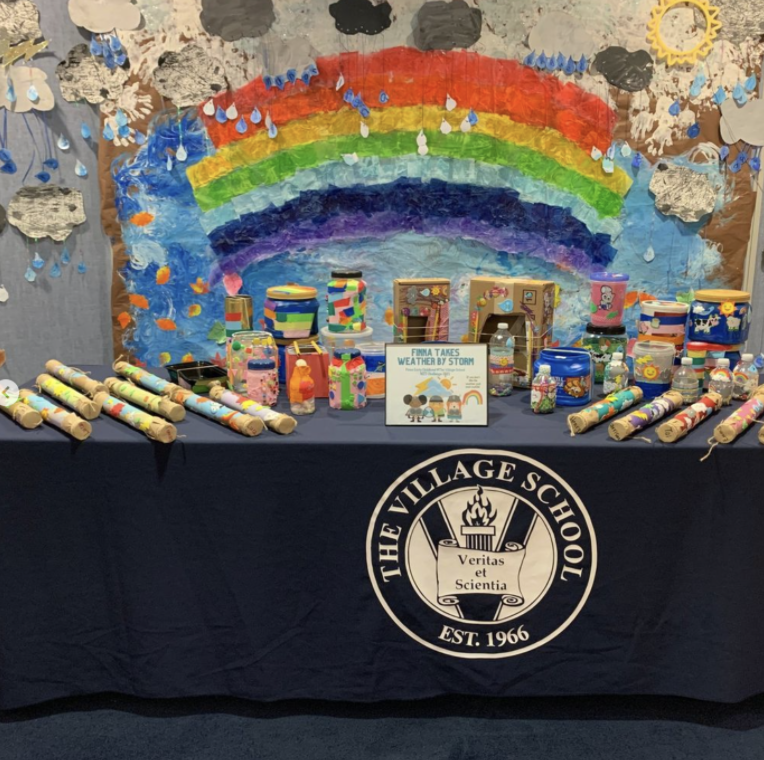
On Monday, November 8, 2021, a couple of these MIT projects were selected to be showcased at the school’s STEAM Day Open House exhibit. Student ambassadors from the Blue Key club toured over 20 visiting families around the school that day and selected students presented the projects they created in their classes to the guests. Overall, the MIT assignments in every classroom were pillars of budding innovation and collaboration.


